


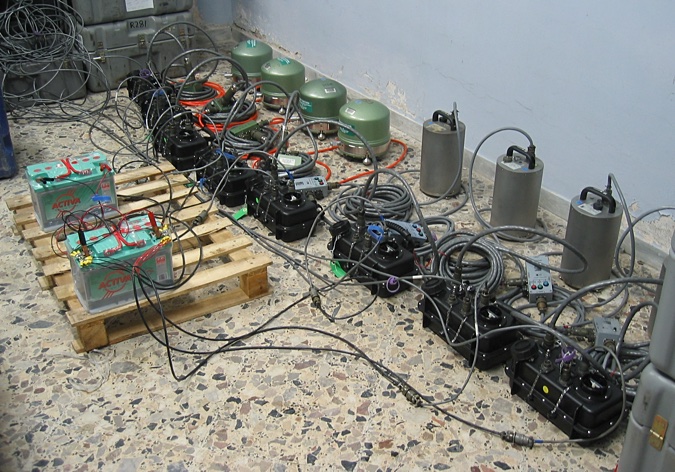
This experiment was scheduled to run for about a year. Each station was set to record the signals from the sensors at a sampling rate of 50 32-bit samples per second. The sensors produced three channels of data each measuring movement of the sensor (and the ground) in one of three different directions: up-down, north-south, or east-west. That all translates to at least 2,160,000 bytes of data per hour per station, and 51,840,000 bytes per day per station. Because of overhead and messages that are recorded by the system it works out to a bit more. That is a lot of data, but not a lot of data for some endeavors these days. At the radio astronomy observatory where I used to work we recorded data at the rate of 125,000,000 bytes per second!
Each of the Reftek RT-130 recorders could be loaded with two Compact Flash memory cards. The memory cards each held 1 gigabyte. So all of this meant that each of the stations needed to be "serviced" roughly every 40 days, more often just to be safe. When both memory cards, or disks, fill up the recorder just stops and does nothing. During the experiment people from INGV, the Lamont facility in New York, and the folks at the university in Cosenza went on service runs about every month.
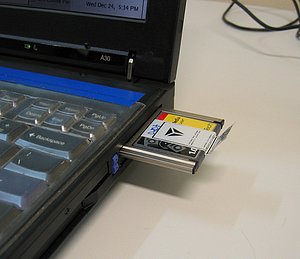
After the memory cards are removed from the recorders they need to have the data extracted from them. This is done with a laptop computer and can be performed at the site, in a hotel room at the end of the day, or when back at the castle in Grottaminarda. Once the data has been transferred to the laptop it is usually converted to a format that can be read by most computer programs used for analyzing seismological data called SEGY.
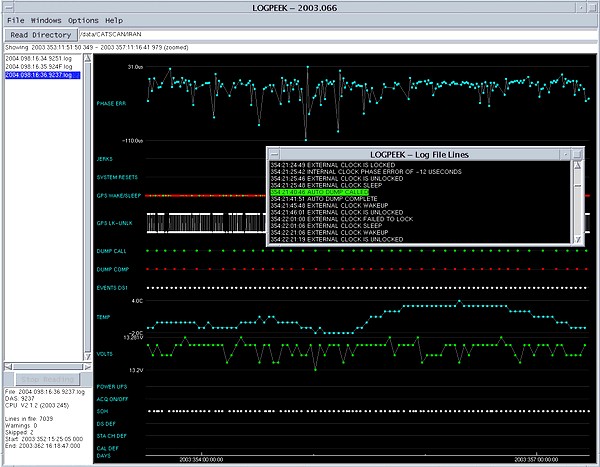
During the conversion to the SEGY format the text messages recorded by the recording system that contain "State Of Health" messages are extracted to a separate file. A program on the laptop is used to graphically look at these files. The information contained in these files include, among other things, the drift rate of the internal clock (when it is compared with the GPS clock signal), when the GPS receiver was turned on and off, how often the data was written from the internal RAM of the recorder to the Compact Flash cards, the temperature of the recorder, and the voltage of the electricity that was supplied by the power system. A quick look at this information can tell you, for example, if the solar panels are getting enough sun to keep the station running or not...that is if the station was running when you got there.
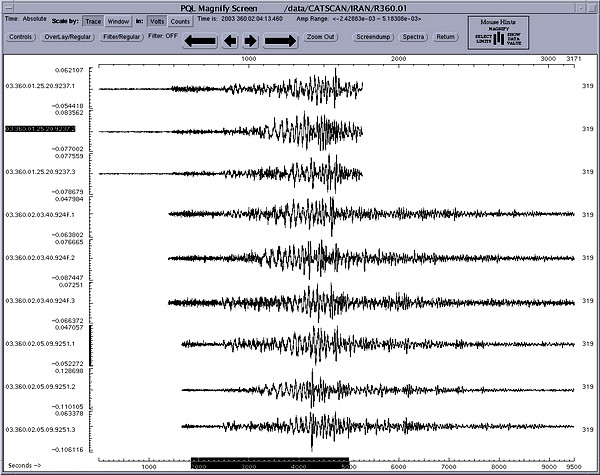
The SEGY data is the recorded signals from the sensors. Using another program the 'squiggly lines' which represent the actual recorded shaking of the ground can be examined. The picture of this program in action, below, is of particular interest. On December 26th 2003 at 01:56:56 GMT there was a magnitude 6.7 earthquake in southeastern Iran. This was called the Bam (name of the town) Earthquake. The picture shows the seismic waves from that earthquake as it was recorded by three of the CAT/SCAN stations that we had installed by that time. While it was nice to know the equipment was really working it was terribly unfortunate that this earthquake killed so many Iraqi people. The first seismogram is the up-down motion of one sensor, second line the north-south motion, and the third line the east-west motion. The forth line is the up-down motion for another station, and so on. Even though the first station looks like it stopped recording right after the earthquake began it really did not. The next 'chunk' of data was just in a different file.
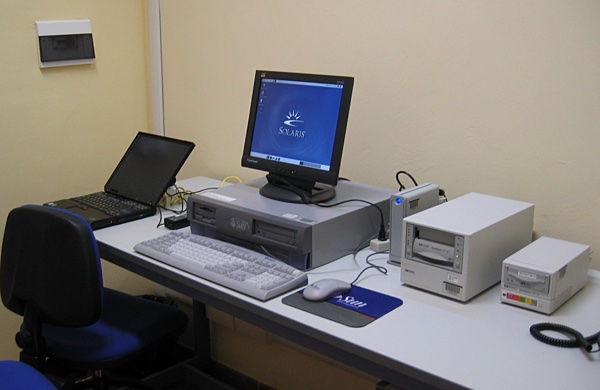
At some point, hopefully before the laptop's hard drive fills up, the raw data (not converted to SEGY) is transferred to a Sun Microsystems workstation in Grottaminarda. This workstation is to be used for writing the raw data to tapes which would then be sent to the Lamont-Doherty Earth Observatory in New York. If the workstation were connected to the Internet then the data could just be transferred electronically. Once in New York the data will be transferred to yet another computer and processed into a different format called SEED. After any problems with the data (timing problems, for example) have been taken care of the data will then be submitted to the what is called the Data Management Center (DMC) in Seattle, Washington. The DMC is part of the Incorporated Institutions For Seismology (IRIS) of which PASSCAL is also a part. The DMC collects the seismic data from projects like our puny, little PASSCAL experiments as well as collecting all of the data, 24 hours a day, 7 days a week from the 100 or so sensors all over the world that monitor the seismic heath of the planet called the Global Seismic Network (GSN).
Once the data reaches the DMC the scientists in NY and in Italy can pull the data back out and do whatever analysis they plan to do. Only people associated with the experiment get to look at the data for 2 years, then it gets released to the "public" (if you have the ability to do something useful with it). Any scientific results, especially if something really amazing is found, will be on CNN. Mainly the data will be used to do things like locate small earthquakes (really small ones) to create a 3-dimensional map of where they are occurring. This way the scientists can see what is going on deep below the surface. The more earthquakes that are recorded the better. That is why the equipment is deployed in the field for a long period of time.
You know...it's really hard writing about stuff that has happened, is going
to happen, was supposed to happen and may never happen all on the same page.
This page tries to describe what was done while I was there, and what I think
was supposed to be done after I left, but with all of the tense changes even
I am confused. They may have all decided that I had no idea what I was doing
and have since ignored everything I taught them.

2014-12-22